Introduction
WebRatio Mobile Platform lets you build Android and iOS apps that you can test on your mobile device and then submit to the Google Play Store or Apple App Store. It’s also possible to debug the mobile application in order to find and solve any issue that may come out during development. GapDebug is third-party software that can be used for this purpose.
This article guides you, step by step, through the app debug process. It shows you how to download, install, configure and use GapDebug for testing a mobile application generated by WebRatio Mobile Platform.
Prerequisites
In order to be able to debug a mobile application using GabDebug you need:
- A device with Android 4.4+ (KitKat or greater), iOS 6 or iOS 7
- The mobile app package installed on your device. To learn how to build your mobile project and get the mobile app package refer to this articles (depending on the target platform), refer to:
- A USB cable to connect the device to the computer
- Chrome browser
- iTunes for debugging iOS apps
- Android USB driver (Windows only) for debugging Android apps
Workstation Configuration
Configure Your Workstation for iOS Debug
You must configure your workstation in order to use GapDebug to debug an iOS application.
- Install the Google Chrome browser. GapDebug requires the Google Chrome browser to host its Debugger user interface. Download the Chrome installer from Google.
- Install Apple iTunes. GapDebug uses the iTunes USB driver to communicate with connected devices. If your workstation does not have iTunes installed, please download iTunes and install it before proceeding.
- Install GapDebug. Double-click on the executable file and follow the instructions on the screen.
Configure Your Workstation for Android Debug
You must configure your workstation in order to use GapDebug an Android application.
- Install the Google Chrome browser. GapDebug requires the Google Chrome browser to host its Debugger user interface. Download the Chrome installer from Google.
- Install the Android USB Driver (Windows only). The Windows version of GapDebug requires the Android USB driver to communicate with connected Android devices. Download the standard and vendor-specific USB drivers from the Android Developer site. Then follow the instructions shown here to install them.
- Install GapDebug. Double-click on the executable file and follow the instructions on the screen.
Device Configuration
You must configure your device in order to use GapDebug for mobile application debugging. Read one of the following sections, depending on your device’s platform.
Configure Your iOS Device
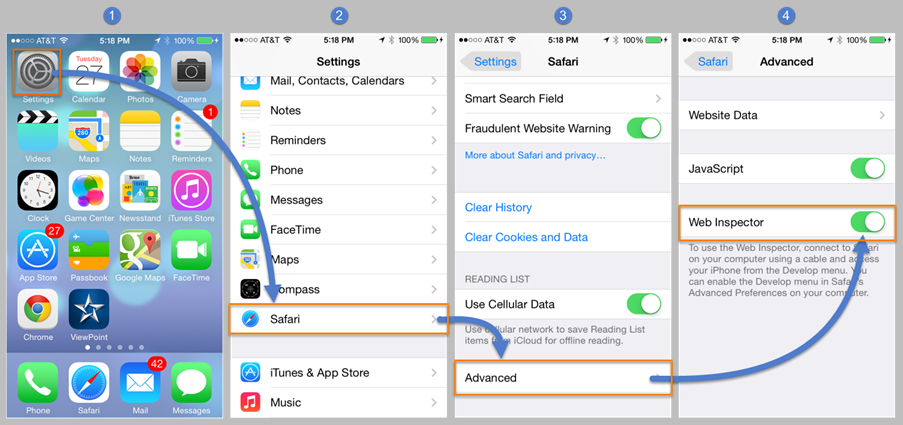
Your Apple device must have the iOS Safari Webkit debugging setting enabled.
- On your iOS device, open the Settings app
- Scroll down, and select Safari
- Select the Advanced option
- Enable the Web Inspector
Configure Your Android Device
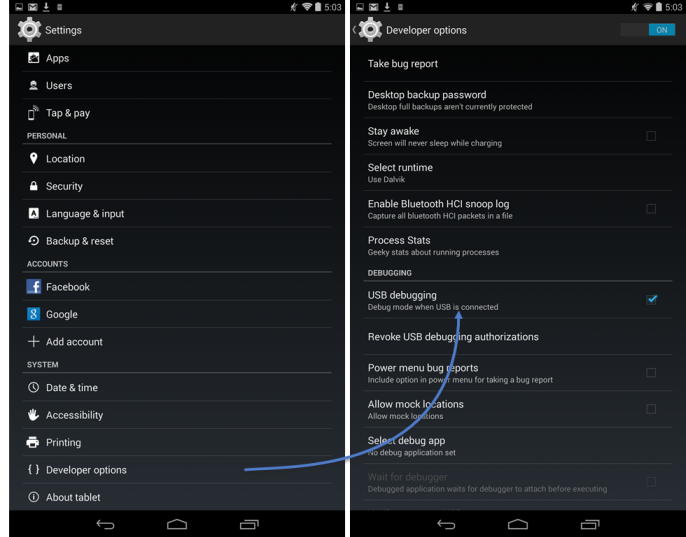
Your Android device must have the USB debugging setting enabled.
- Open Settings > Developer Options. If Developer Options is not listed, open the About details, tap the Build Number field 7 times, and then select Back to view Developer Options.
- Enable the USB Debugging option.
Install an App on Your Device Using GapDebug
Follow these steps to get the mobile application installed on your device and to start debugging it.
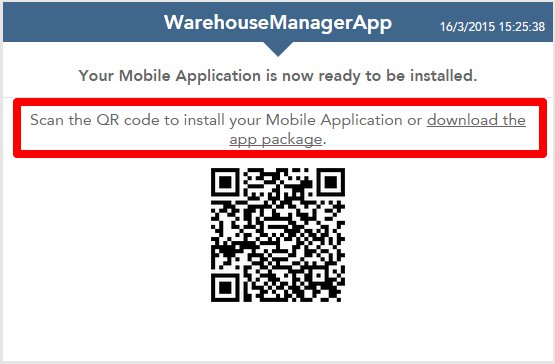
- Build the application package file (apk or ipa) using the build configuration dialog of WebRatio Mobile Platform.
- Download the package on the local hard drive of the computer by clicking on the link provided in the dedicated dashboard.
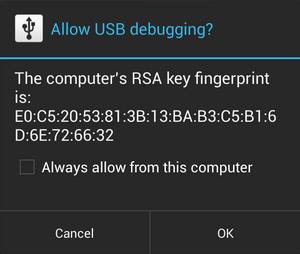
- Connect the device through the USB cable to the computer. Note that the very first time you plug in an Android device and enable the USB debugging options, you get a dialog asking confirmation on your device. You must accept it to proceed.
?
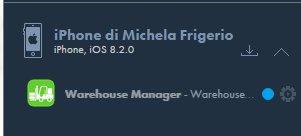
- If the device is plugged in correctly, you will see the device in the list of the connected ones in the left panel of GabDebug.
- Press the “Install” button next to the device on which you want to install the app and select, from the hard drive, the apk or ipa package of the desired app. After this operation, the mobile application is installed on the device and you can see it just below the connected device.
Debug an App on Your Device Using GapDebug
Let’s use the Warehouse Manager App available on the WebRatio Add-ons as case study for the mobile application debug. What you need to do is to download and create a debug build of the project for your device and install the mobile application.
To start the debug you need to launch the app from your Device. This makes GapDebug show you an item below the device, related to the app. Then select the app to open the Debugger View.
The Debugger View is a little different between iOS and Android devices. You can find more information about the Debugger View in the GapDebug User Guide available here. In both cases you have a Resource tab, where you can see all the resources used by the mobile application, in terms of images, fonts, CSS and JavaScript files. The most interesting resources are the JavaScript ones, which contain the behavior of the mobile applications. In particular, pay attention to the following scripts:
- mvc.src.js. This file contains the implementation of the MVC architecture of the mobile application generated with WebRatio Mobile Platform. This implementation is based on Angular.js. The main goal of the file is to orchestrate the runtime engine, executing components in the correct order and at the proper time.
- wrm.src.js. This file is the runtime engine of the mobile application generated with WebRatio mobile. This runtime engine is independent from Angular, which is the chosen technology. It defines the internal behavior of the interaction model: screen, toolbar, action and so on. It contains also the algorithm that communicates with the back end as well as the data synchronization algorithm.
- SqlLiteProvider.js. This is the file containing all the code necessary to make queries on the local database. The main item to remember here is the executeSql, which contains the execution of all queries.
How to Debug a View Component
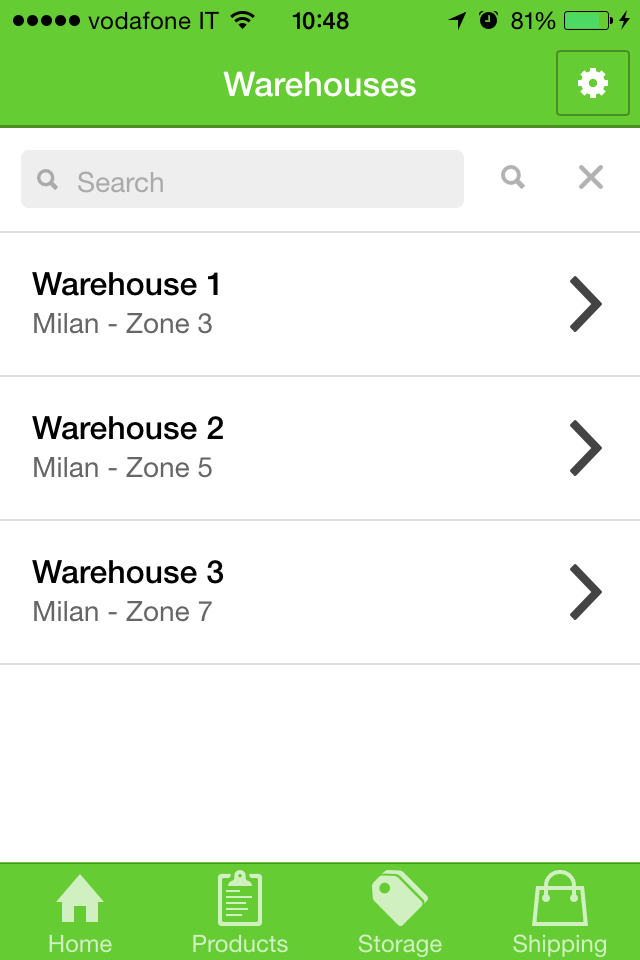
Let’s suppose that you want to debug the execution of the List component showing the Warehouse in the Home screen of the Warehouse Manager App. In particular, what you may want to check is the query executed on the local database and the data retrieved by the component to be shown on the screen.
- Let’s start by adding a breakpoint in the code.
- Select the Resources tab and expand the “Scripts” folder.
- Select the “wrm.src.js” file.
- Search for the “ListService” in the file to reach the section containing the JavaScript service of the List component.
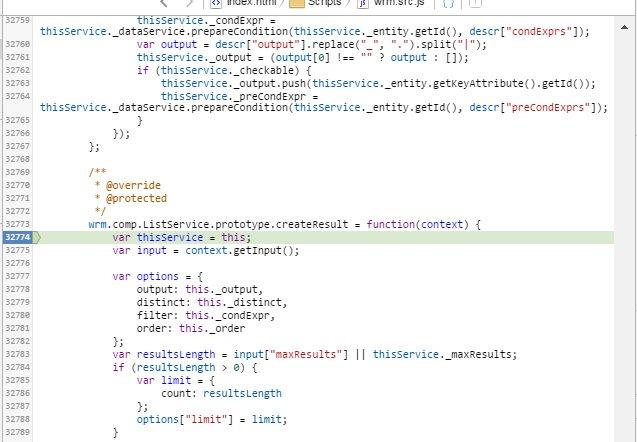
- Search for the createResult method.
- Click on the line number to add a breakpoint.
- Now run the test on the app. You need to go back to the home screen.
- Tap on “Settings” and then on “Back”.
- The execution stops at the breakpoint. Looking at the main bar, you can see that the Debugger View is waiting for your input to proceed, and you will then see something like the following image:
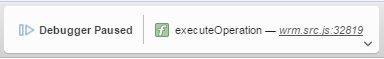
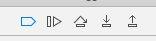
- Use the debug commands to resume the code execution. In the top left of the Debugger View, you have a set of commands to pilot the code execution. Experiment with each command. The available options are (from left to right):
- Enable All Breakpoints: enables all breakpoints added to the scripts.
- Continue Script Execution: resumes the code execution until the next breakpoint is reached.
- Step Over: resumes the code execution to the next line of code.
- Step Into: resumes the code execution to the next line of code, also considering the code of the eventual function called in that specific line.
- Step Out: resumes the code execution to the next line of code outside the current function.
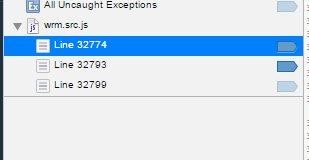
- Let’s add another breakpoint in the section where the data are returned by the function. The involved section is included inside a call to a Promise function. This is a particular function that is asynchronously executed by the runtime; the best way to debug it is to set a breakpoint inside the function so that the execution stops just after the Promise function is called (using only the “Step Over” command does not work because the Promise call is not synchronous). Now you have two breakpoints in your code. Remember that you can see the breakpoints list on the left of the Debugger View.
- Continue the Script Execution until reaching the last breakpoint. Now you can watch the value of all local variables of the function; specifically, you can have a look at the “results” variable, which contains the data set extracted from the local database. Variables are shown on the right of the Debugger View.
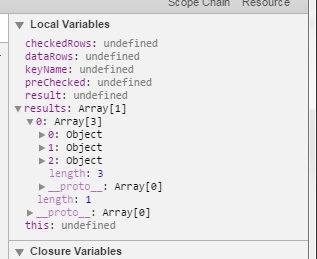
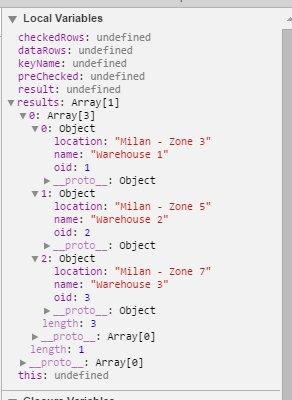
As you can see, the “results” variable is an array containing three different objects that correspond to the three warehouses you will see on the screen. You can expand the data structure to check the data for each object.
- Continue the Script execution until the screen is rendered, and check that the information shown correspond to the data you saw in the Debugger View.
In this way, you checked the retrieved data but you didn’t see which query was executed on the local database. Let’s suppose you want to check that query in order to be sure that corresponds to what is modeled in the mobile project.
- Add a breakpoint in the _retrieveData method of the ListService, at the row in which the select method is invoked. Here you can check the information used to build the SQL query. This information is retrieved from the model through the component descriptor file.
- Select the Resources tab and expand the “Scripts” folder.
- Select the wrm.src.js” file.
- Search for the “ListService” in the file to reach the section containing the JavaScript service of the List component.
- Search for the _retrieveData method.
- Click on the line of the select method invocation to add a breakpoint
- Now run the test on the app. You need to go back to the home screen.
- Tap on “Settings” and then on “Back”.
- The execution stops at the first breakpoint.
- Continue the Script Execution until reaching the just-added breakpoint. Have a look at the Variables section on the right.
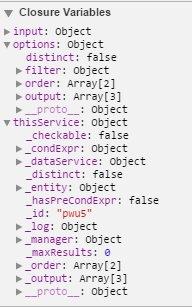
One of the available variables is the options object. This object contains all the information about the modeled operation. This information is retrieved from the component descriptor file. You can compare the options object with the descriptor content by opening the related file.
- Select the operation in the model.
- Right-click on it and select Open Generated Code -> Logic Descriptor.
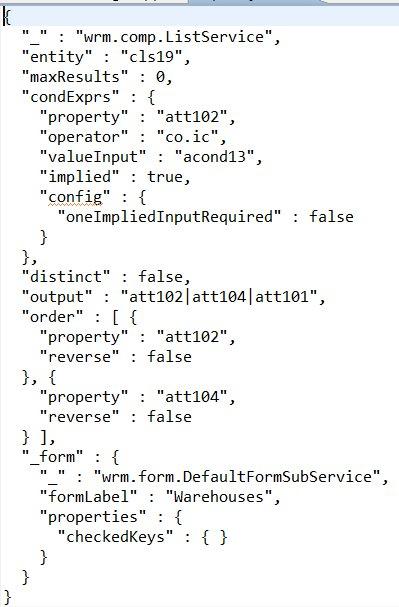
You can see, in the images above, the variables section of the Debugger View and the Logic Descriptor of the operation. If you look at the content of the options object, you can see a filter object specifying the conditional expression modeled for the component corresponding to the condExprs node of the descriptor, the order object stating the order that should be used to retrieve elements, and the output object with the list of attributes that must be retrieved.
Now let’s proceed to see if the generated SQL query corresponds to these criteria.
- Add a breakpoint in the SqlLiteProvider.js code.
- Select the Resources tab and expand the “Scripts” folder.
- Select the “SqlLiteProvider.src.js” file.
- Search for the executeSQL function at the end of the file.
- Click on the first line of the method to add a breakpoint.
- Now run the test on the app. You need to go back to the home screen.
- Tap on “Settings” and then on “Back”.
- The execution stops at the first breakpoint.
- Continue the Script Execution until reaching the just-added breakpoint. To see the value of the query that is going to be executed, mouse over the “sql” variable. You will see SQL code like the following:
SELECT T0.rowid AS rowid$$, T0.name AS att102, T0.location AS att104, T0.oid AS att101 FROM data_productData_WarehouseSet T0 ORDER BY T0.name ASC, T0.location ASC
How to Debug an Operation
Let’s suppose that you want to debug the execution of the Delete operation invoked when deleting a company from the “Setting -> Companies” section of the Warehouse Manager App.
- Let’s start by adding a breakpoint in the code of the delete service.
- Select the Resources tab and expand the “Scripts” folder.
- Select the “wrm.src.js” file.
- Search for the “DeleteService” in the file to reach the section containing the JavaScript service of the Delete operation.
- Search for the executeOperation method.
- Click on the line number to add a breakpoint
- Add a breakpoint in the SqlLiteProvider.js code.
- Select the Resources tab and expand the “Scripts” folder.
- Select the “SqlLiteProvider.src.js” file.
- Search for the executeSQL function at the end of the file.
- Click on the first line of the method to add a breakpoint.
- Now run the test on the app. You need to go back to the home screen.
- Tap on “Settings” and then on “Companies”.
- Select a company from the list.
- Tab on the Trash icon to delete the company.
- The execution stops at the first breakpoint.
- Continue the Script Execution until reaching the breakpoint in the SqlLiteProvider.js. To see the value of the query that is going to be executed, mouse over the “sql” variable. You will see SQL code like the following:
SELECT * FROM data_productData_CompanySet T0 WHERE (T0.oid in (?))
This if the first query executed, which retrieves the object that is going to be deleted in order to check if the object exists.
- Continue the Script Execution until reaching the breakpoint in the SqlLiteProvider.js. To see the value of the query that is going to be executed, mouse over the “sql” variable. You will see SQL code like the following:
DELETE FROM [data_productData_CompanySet] WHERE(([oid] == ?));
This is the SQL executed to delete the company selected by the user.