Introduction
The BAM (Business Activity Monitor) is a software whose purpose is to aggregate, analyse, and present information about the run-time behaviour of a Business Processes based applications.
WebRatio provides a wizard that automatically creates a BAM Project that is able to monitor WebRatio applications based on BPM Projects.
The Business Activity Monitor application
The BAM is an application that connects to an application database through a scheduled automatic operation (see Scheduling Batch Operations for further details) and retrieves all the run-time informations related to the BPM such as Start time, End time, Activation time of all the tasks. Beside the data retrieval, the BAM evaluates and transforms all the retrieved information, providing high-level data usable for process management such as Execution Time and Wait Time of every BPM element, with weekly, monthly, quarterly and yearly aggregation. Moreover the BAM provides a monitoring service through the definition of alarms. It's possible to choose the variables for which the BAM must control the values and, when their values go beyond defined thresholds, the application will send emails to a group of users comunicating that the alarm has been raised.
The Domain Model of the monitored Web Application
The BAM application is based on a Domain Model mapped on two different databases: the former is the part containing all the run-time information (mapped on the database on which the controlled BPM application is based), the latter is the part containing all the aggregated information (mapped on a database used by the BAM application directly).
Every WebRatio BPM application uses this Domain Model in order to manage the execution of the BPM.
Basically, the Data Model is structured as follows:
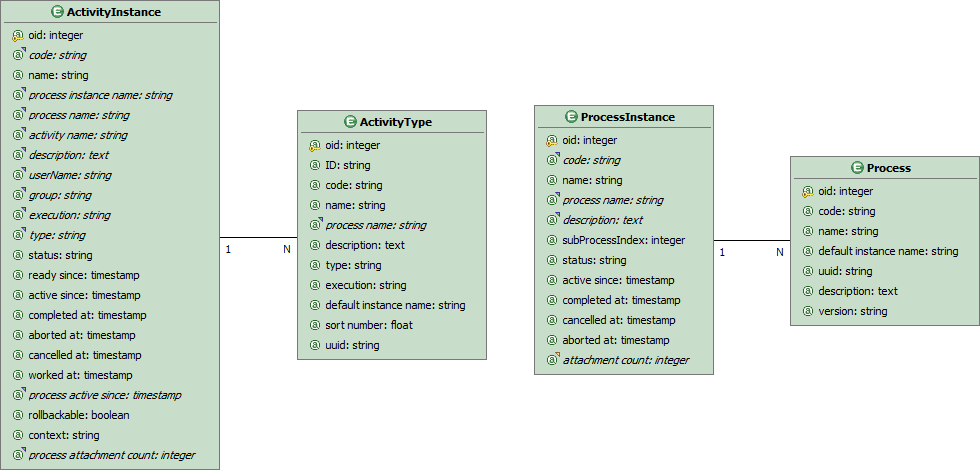
During its execution, the application accesses to these Entities to retrieve information about all the processes and the activities that have been executed. Such information deals with activation and execution times, in particular:
- The "Process" Entity contains the representation of all the processes supported by the Web Application.
- The "ActivityType" Entity contains the representation of all the activities of which every process is composed of.
- The "ProcessInstance" Entity contains all the process instances created by the application during it's execution (whether automatic or user-started processes).
- The "ActivityInstance" Entity contains all the activities executed within the execution of process instances.
- From the "ProcessInstance" Entity, the retrived Attributes are:
- "active since": the moment in which the process instance has been created.
- "completed at": the moment in which the process instance has been completed (if that's the case).
- "cancelled at": the moment in which the process instance has been canceled (if that's the case).
- "aborted at": the moment in which the process instancs has been aborted (if that's the case).
- From the "ActivityInstance" Entity, the retrieved Attributes are:
- "ready since": the moment in which the activity instance has become ready to be executed.
- "active since": the moment in which the activity instance has become active (i.e. an actor started to execute it).
- "completed at": the moment in which the activity instance has been completed (if that's the case).
- "cancelled at": the moment in which the activity instance has been canceled (if that's the case).
- "aborted at": the moment in which the activity instancs has been aborted (if that's the case).
It's possible to notice that the data stored in the runtime database of the BPM application are low-level. These are aggregated into more high-level data in the BAM database.
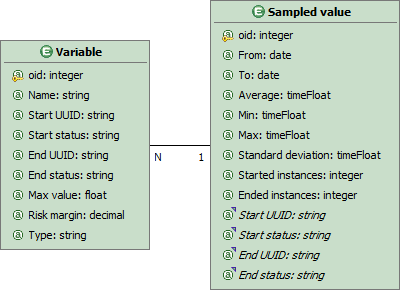
This task is performed for all the elements of the Processes, storing the values in variables. These variables are predefined by default or custom. The default variables measure the Wait Time, Execution Time, Life Time of every Task composing the measured processes (and every whole process itself):
- Execution Time: the average (with standard deviation), maximum and minimum time passed between the instants active since and completed at (or cancelled at or aborted at).
- Wait Time: the average (with standard deviation), maximum and minimum time passed between the instants ready since and active since.
- Life Time: the average (with standard deviation), maximum and minimum time passed between the instants ready since and completed at (or cancelled at or aborted at).
For example, the BPM has a variable which measures the execution time of the Edit Report task.
The BAM application relies on two different databases, the former is the monitored Web application database, containing all the information to be managed, the latter is the BAM database, containing all the aggregated informations.
Create a BAM Project
WebRatio provides a wizard that allows the user to easily create BAM Projects, automatically connected to BPM-based applications.
To correctly create a BAM Project, its necessary to have in the workspace the Web Project of the application to be monitorized, along with the BPM Project.
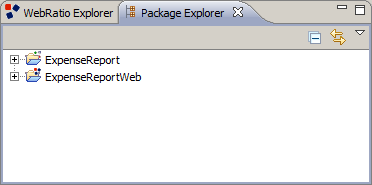
For instance, you can use the Expense Report (available on WR-Addons) and an empty Web Project (called ExpenseReportWeb) synchronized with it.
To synchronize the Web project you can follow this article.
Note: The Web project must have a database synchronized with the Domain Model entities.
The following picture shows the final workspace:
To create a BAM Project:
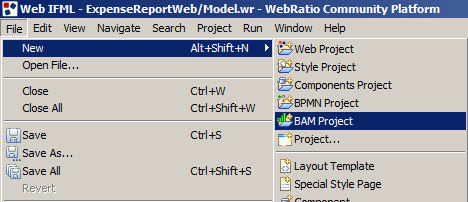
- Select File -> New -> BAM Project.
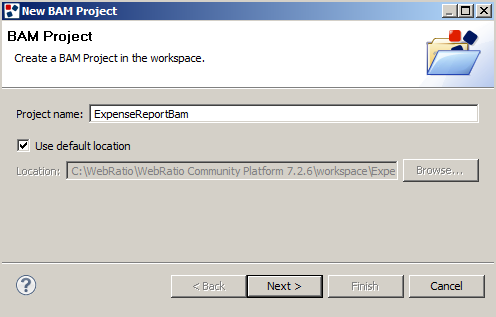
- Provide a project name and press on Next.
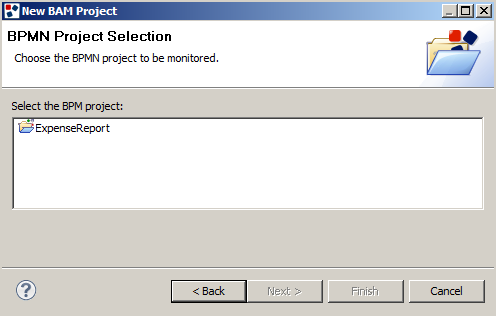
- Select the BPM Project on which the BAM project is based and press on Next.
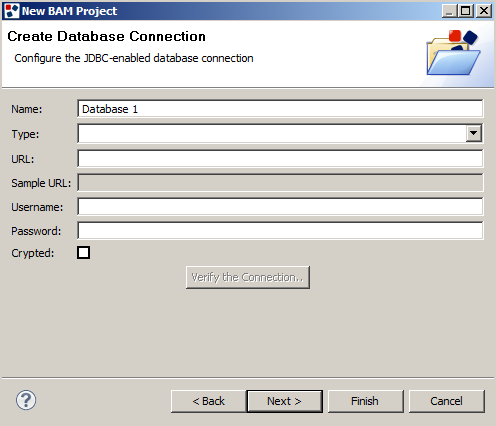
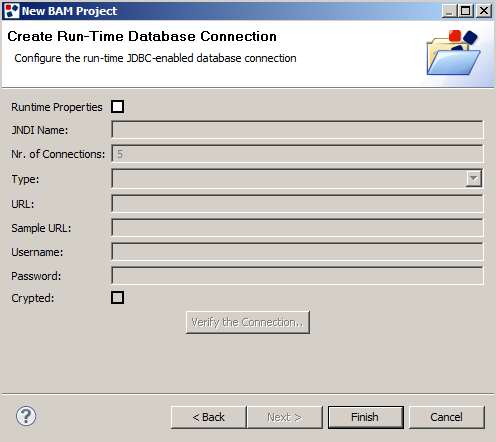
- Provide Database connection information for the Database used by the BAM application to store the aggregated data and press on Next. The BAM database is completely separated by the Web Application database, previously created. The data are taken from the Web application database and the results of their statistical computations are stored in the BAM database.
- Configure the run-time database information and press Finish.
- In the newly opened window, choose the actual Web Project the BAM application must connect to
Note: This step will be skipped if the workspace doesn't contain any Web Project synchronized with the BPM Project and having the database synchronized with the Domain Model Entities.

Once the BAM Project has been created, it can be managed as a normal Web Project, synchronizing the Domain Model, modifying the Project and generating the application to be deployed.
Measured Variables
The BAM works measuring predefined variables. These variables are predefined by default or custom. The default variables measure the Wait Time, Execution Time, Life Time of every Task composing the measured processes (and every whole process itself):
- Execution Time: the average (with standard deviation), maximum and minimum time passed between the instants active since and completed at (or cancelled at or aborted at).
- Wait Time: the average (with standard deviation), maximum and minimum time passed between the instants ready since and active since.
- Life Time: the average (with standard deviation), maximum and minimum time passed between the instants ready since and completed at (or cancelled at or aborted at).
The Custom variables are used when it's necessary to measure some part of interest of a process, e.g. the execution time of a set of task or of a particular path of a process. the Custom Variables are defined in the BPM Project using the Measurement Tools.
Measurement Tools
The Measurement Tool are placed in the palette of tools for designing BPM Projects.

They represent the start and the end of a time measurement and must be placed on the first and last Flow Connectors of the part of Process to be measured. The Measurement Tools are activated in the instant in which the chosen Flow Connector is activated (i.e. when the next activity reaches a particular status, chosen in the measurement tool itself).
- Start Measurement: this tool represents the instant in which the measurement starts. It is configured with the properties:
- Name: the name that identifies the Measurement Tool.
- Measured Element: shows the Process Element activated by the Flow Connector associated to the Tool.
- Status: represents the status of the Measured Element in which the measurement starts. If the Measured Element is a User executed Element (e.g. a User Task), this property might contain the values Active or Ready. If the Measured Element is a Service executed Element (e.g. a Service Gateway), this property will contain only the value Active.
- Stop Measurement: this tool represents the instant in which the measurement ends. It is configured with the properties:
- Name: the name that identifies the Measurement Tool. This property is used also in the BAM application as name of the custom variable.
- Measured Element: shows the Process Element that activates the Flow Connector associated to the Tool.
- Status: represents the status of the Measured Element in which the measurement ends.
Configuration of the BAM application
Once the BAM application has been deployed, it must be configured in order to monitor the execution of the application. In order to configure the application it's necessary to complete the following tasks:
- Connect the BAM Application to the BPM Web Application in order to load the variables definition.
- Execute the import data functionality in order to calculate the aggregated variables.
- Configure the Alarms in order to monitor the run-time behaviour of the BPM Web Application.
- Configure the thresholds of the variables in order to evaluate the results.
After these steps the BAM Application will work autonomously importing and managing data.
Connect the BAM Application to the Web Application
in order to connect the BAM Application to the actual Web Application it's necessary to:
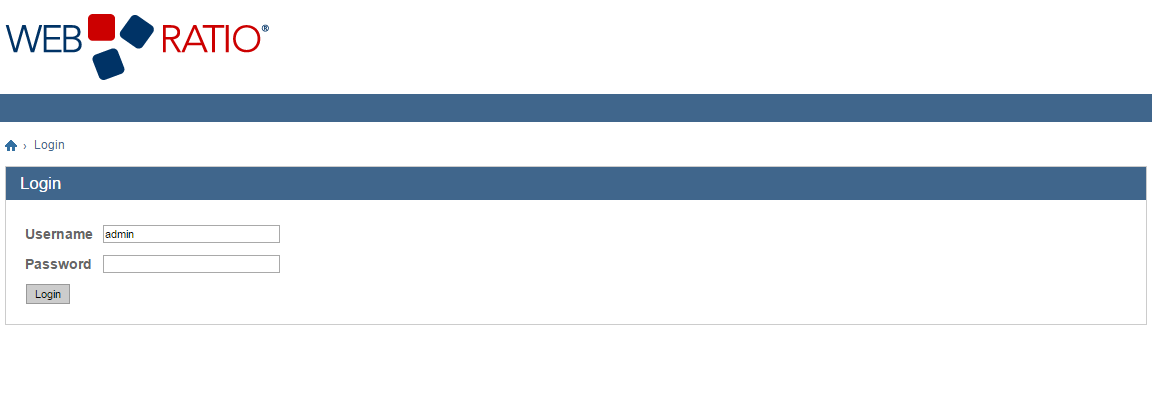
- Log in in the BAM Web Application. Use the default user with username admin and password admin.
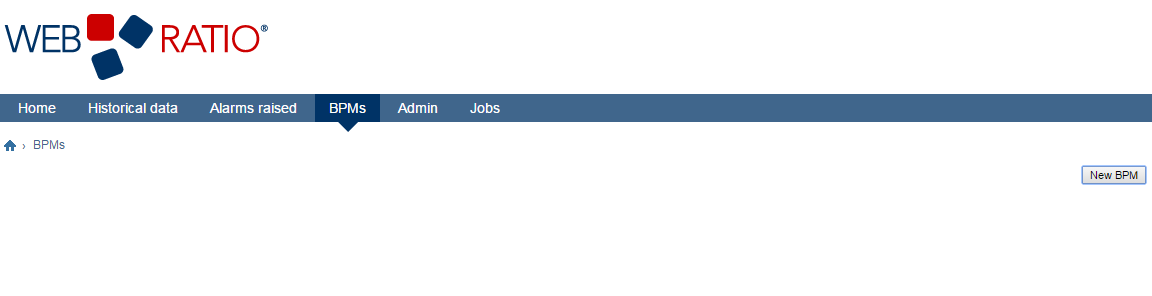
- Click on the New BPM button.
- Insert the values of the Web Application to be monitored.
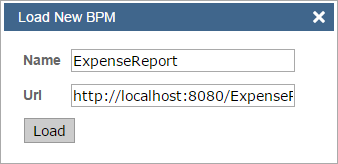
In order to connect the BAM Application to a BPM based Web Application we must provide the following information:
- Name: the internal name that identifies the application in the BAM Application.
- Url: the URL of the BAMVariables.xml file. Every Web application based on BPM contains an XML representation of all the BAM variables defined in the processes (the BAMVariables.xml file). In order to correctly define the URL to that file, we must substitute the "bpm" word of the sample URL with the name of the BPM Project (e.g. http://localhost:8080/ExpenseReport), or the Web Project (e.g. http://localhost:8080/ExpenseReportWeb), leaving unchanged the part of the URL that identifies the file (e.g.:http://localhost:8080/ExpenseReportWeb/wr-bpm/BAMVariables.xml).
- Copy and paste the URL in the navigation bar of your browser to generate the BAMVariables.xml file.
- Click on the Load button. This cause the application to load the BAMVariables.xml file and parse it in order to import all the variables definitions.
Import data and calculate aggregate information
The BAM application provides some functionalities that periodically import the raw data from the Web application and aggregate values calculating variables. These functionality are automatically invoked (by default every night) through a schedule defined at design-time. Nonetheless it's possible to force the execution of these functionalities to immediately import new data and calculate variables values through these steps:
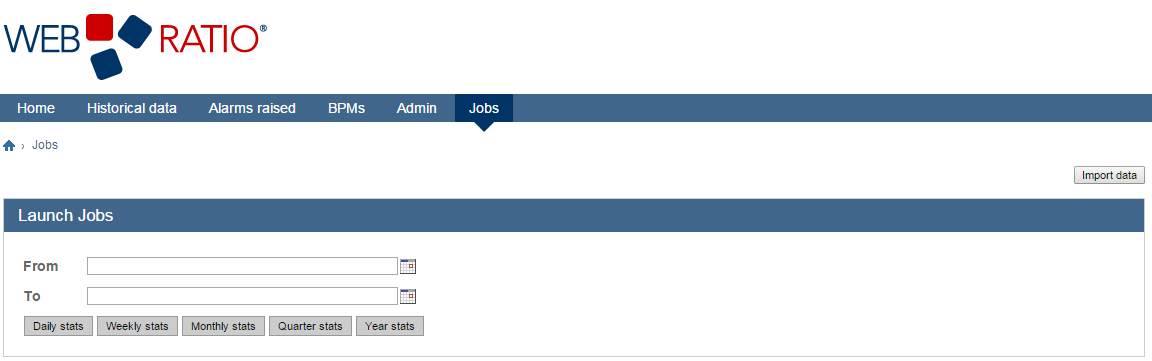
- Click on the JOBS link.
- Click on the Import Data button.
This will cause the execution of the functionality for the data import, after which it's possible to execute the functionalities to calculate the variables.
Due to the possible long time on which the Web application has been in execution, there might be big amounts of run-time data to be aggregated.
To limit the execution time of the aggregation functionalities, it's necessary to insert the start and end dates of the data to be aggregated:
- Insert the From date in the Field.
- Insert the To date in the Field.
- Click on the Daily Stats button to calculate the values of the variables aggregated by Day.
- Click on the Weekly Stats button to calculate the values of the variables aggregated by Week.
- Click on the Monthly Stats button to calculate the values of the variables aggregated by Month.
- Click on the Quarter Stats button to calculate the values of the variables aggregated by Quarter.
- Click on the Year Stats button to calculate the values of the variables aggregated by Year.
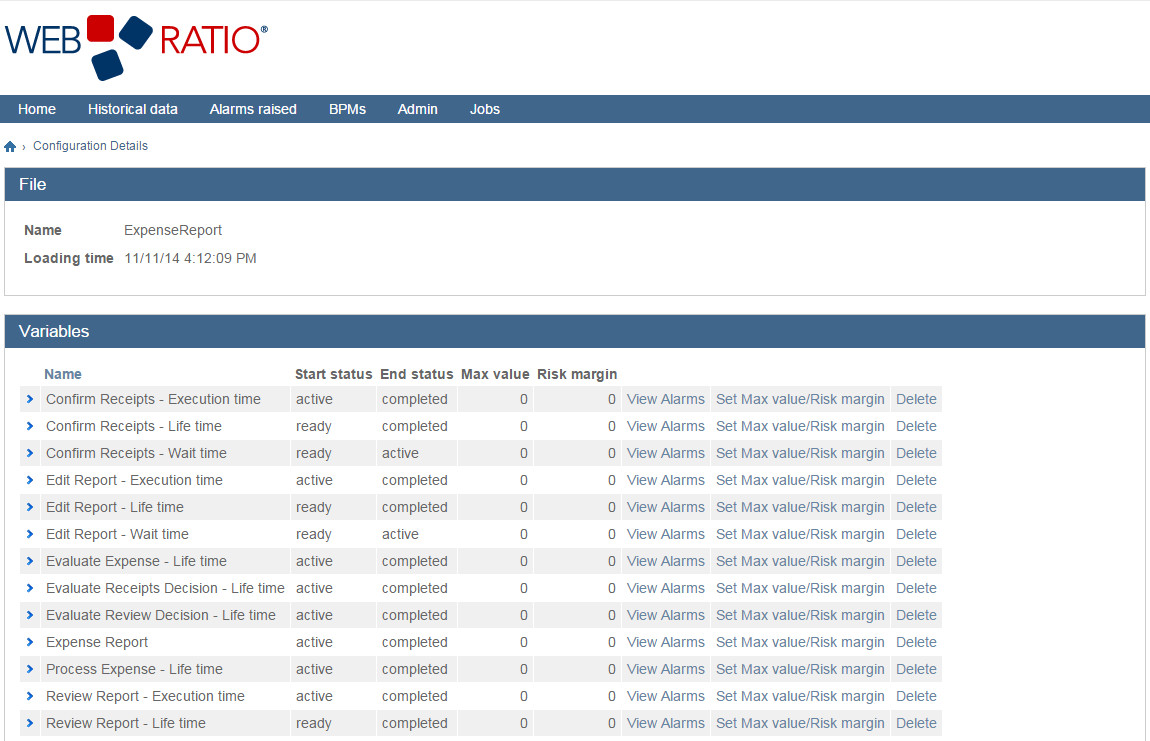
After the execution of these steps, all the aggregated information are visible in the details page of the variables.
Configure the Alarms
Alarms are defined on a Process variable with a threshold and can be configured on a single instance or on average value:
- "on single instance": when the value of the Alarm variable for a Process instance goes beyond the threshold, the Alarm is raised.
- "on average value": when the average value of the Alarm variable goes beyond the threshold, the Alarm is raised.
The first kind of Alarms are used to manage problems on single Process instances, the second kind of Alarms are used to manage problems on overall performance of the Processes. To configure an Alarm:
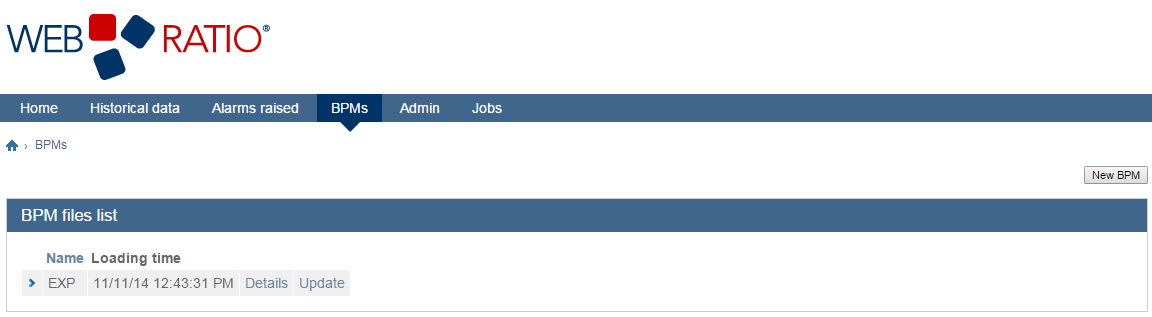
- Click on the BPMS link.
- Click on the Details link next to the BPM on which we want to define the Alarm.
- Click the View Alarms link next to the Variable on which we want to define the Alarm.
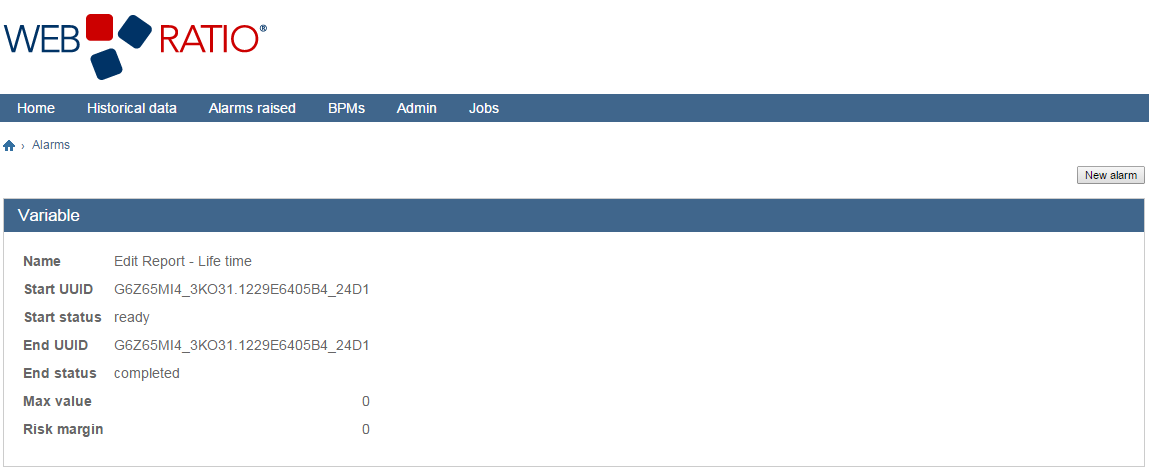
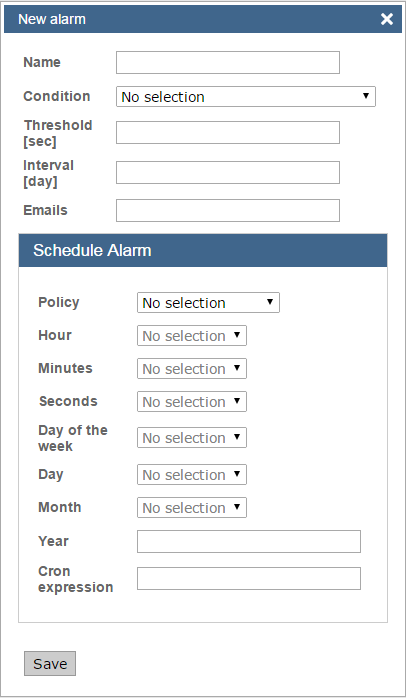
- In the details page it's possible to define new Alarms clicking on the New Alarm button.
- In the newly opened window insert the new Alarm dat.
- Name: the name identifying the alarm.
- Condition: the two values Average > threshold and At least one value > threshold define the Alarm check as based on single instance or on average value.
- Threshold [sec]: the threshold above which the Alarm is raised (expressed in seconds).
- Interval [day]: the period (expressed in days) over which the variable is calculated for the threshold check.
- Emails: the list of emails (divided by semicolons) of the receivers of the notification in case of Alarm raised.
- In the Schedule Alarm section insert all the information to schedule the execution of the Alarm check.
Configure the thresholds of the Variables
The threshold are used as a comparative value in order to classify the Variables value. The threshold are define for each Variable with the values:
- Max value: the absolute value expressed in seconds of the threshold.
- Risk margin: the range (expressed in precentage) in which the value is considered "near" the threshold.
To configure a threshold:
- Click on the BPMS link.
- Click on the Details link next to the BPM on which you want to define the thresholds.
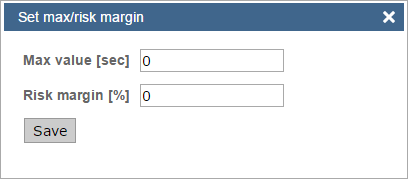
- Click the Set Max value/Risk margin link next to the Variable on which we want to define the threshold.
- In the newly opened window insert the Max value and the Risk margin of the threshold of the Variable.
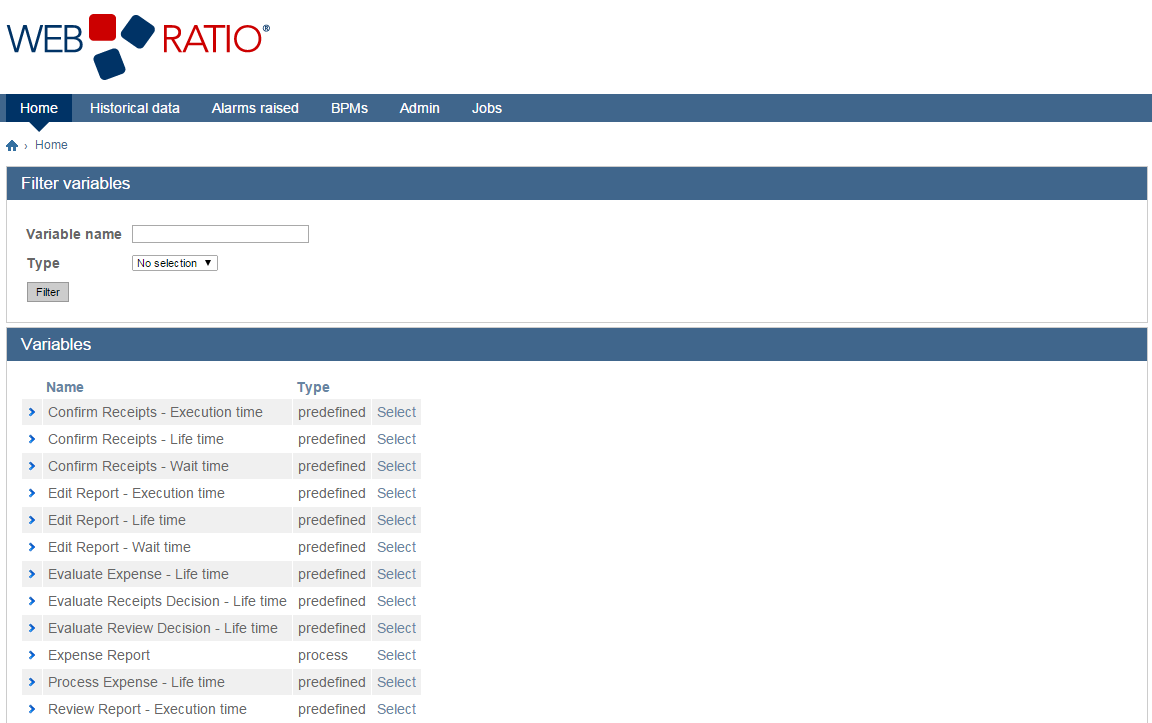
How to use the BAM Application
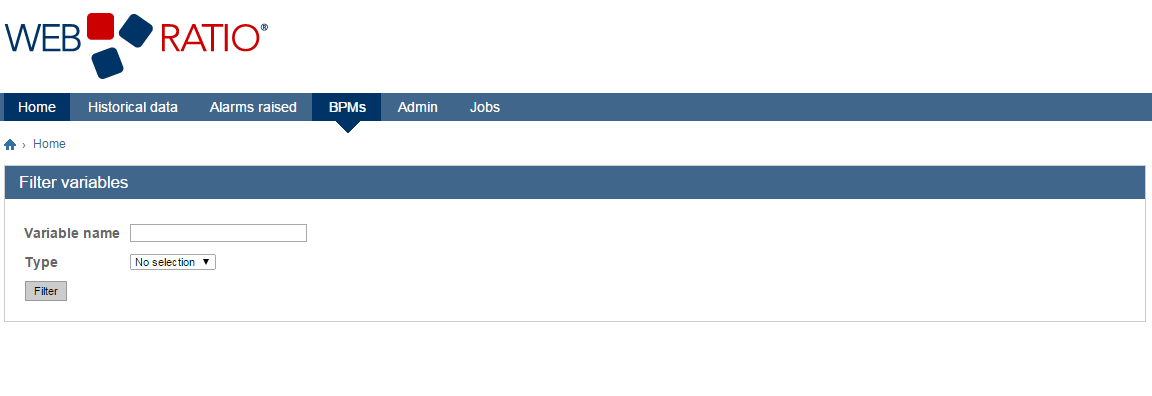
Once the BAM application has been configured, it's possible to use it to monitor the execution of the Web application. In the Home page, all the monitored variable are listed and it's possible to click on the Select link to view the calculated statistics of each Variable.
In the View Statistics page for each Variable are displayed:
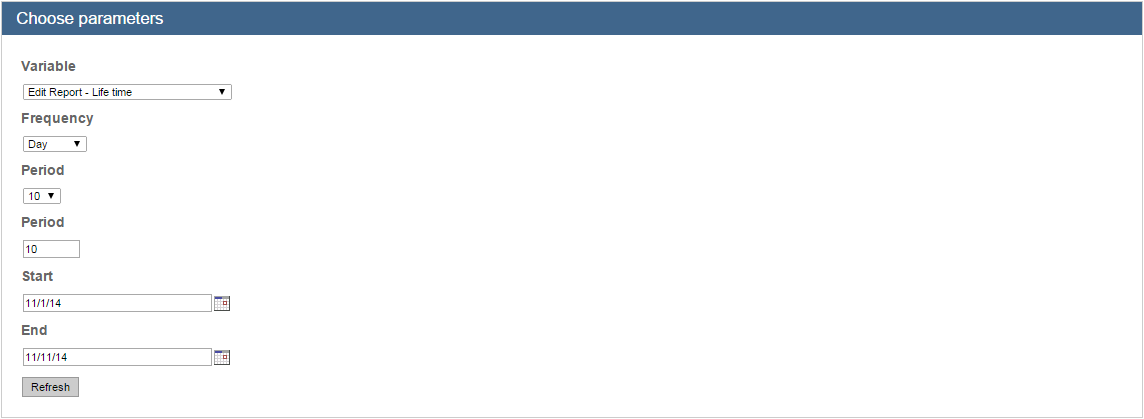
- The Choose Parameter section lists all the configuration option for the statistics displayed:
- Variable: the variable which statistics are displayed.
- Frequency: the aggregation of the statistics (by Day, by Week, by Month, by Quarter or by Year).
- Period: the number of elements displayed (according to the Frequency), it's possible to choose values from a list or write a custom Period in the field above.
- Start: the start date of the data displayed.
- End: the end date of the data displayed.
Once the parameters are changed it's possible to click on Refresh in order to display data with the new configuration.
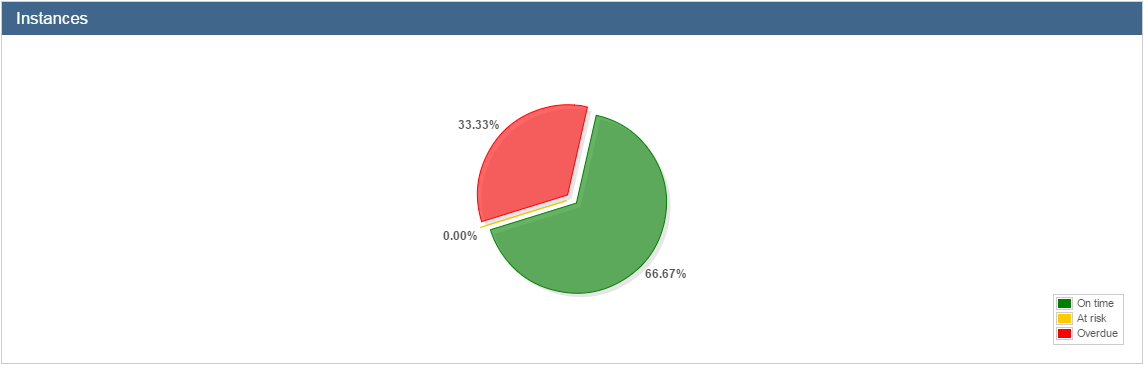
In the Instances section a pie chart is displayed showing the Variable instances divided in:
- In Time: all the Variable instances above the threshold value (Max Value) defined for that Variable.
- At risk: all the Variable instances within the range below the Max Value defined with the Risk margin for that Variable.
- Overdue: all the Variable instances above the Max Value.
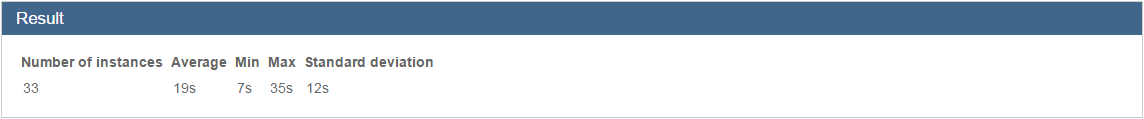
In the Result section all the numeric value are displayed to show the Statistics characteristics
- Number of instances: the number of Variables instances taken into account.
- Average: the average value of all the Variable instances taken into account.
- Min: the minimum value among all the Variables instances taken into account.
- Max: the maximum value among all the Variables instances taken into account.
- Standard deviation: the standard deviation calculated on all the Variable instances taken into account.
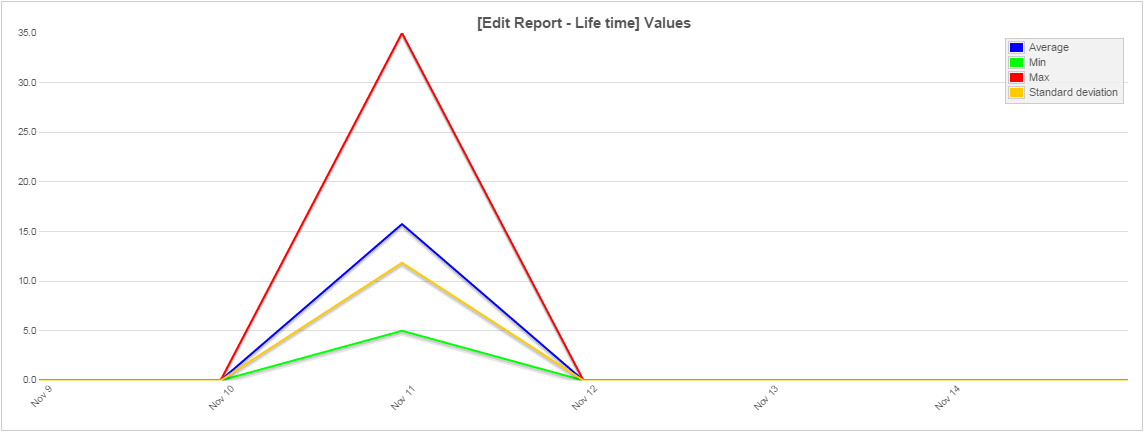
In the below section, all the execution times are displayed in a chart, aggregated according with the Frequency field.
For every point in the x-axis are displayed:
- Average: the average execution time.
- Min: the minimum execution time.
- Max: the maximum execution time.
- Standard deviation: the standard deviation of all the values.
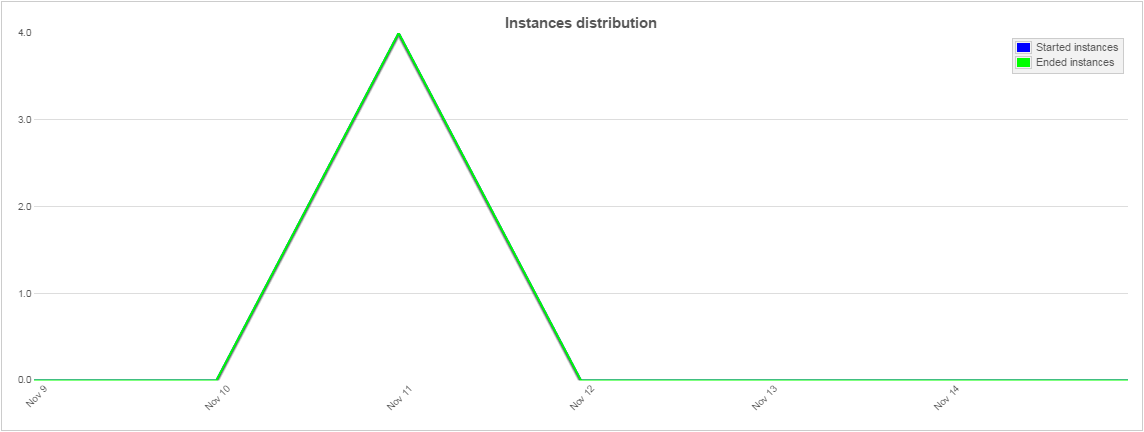
In another section, the started and completed instances distribution is showed in a bar chart, according to the aggregation chosen in the Frequecy field.